ABSTRACT:
The advent of big data, crowdsourcing, and the proliferation of mobile devices has put a
virtually unlimited amount of information in the hands of users in real-time, allowing them to
optimize their movement through space with respect to current conditions. One such case is
the live traffic map layer that we are accustomed to seeing to determine the routes we take to
our destinations, which in the twenty-first century has even led to the development of a
well-known cartographic convention using the colors of a stoplight as a metaphor for traffic
congestion. The present study seeks to apply these concepts to the maritime sector, which increasingly
faces the same challenges related to congestion. Unlike street traffic maps, marine navigation
entails some unique characteristics in terms of both the data itself as well as its cartographic
representation. To that effect, unique data sources are obtained through web-scraping as the
basis for the study. Armed with maritime traffic data from the Strait of Gibraltar (between
Africa and Europe) for two weeks in the summer of 2022, several cartographic representations
of the data are presented that make way for both a series of analyses to aid in strategic and
tactical decision making, as well as proposals for operational and real-time decision support.
Following is a selection of cartographic products from the thesis (in Spanish). Select each of the three thematic maps to expand and find a brief description at the bottom in white text (in English).

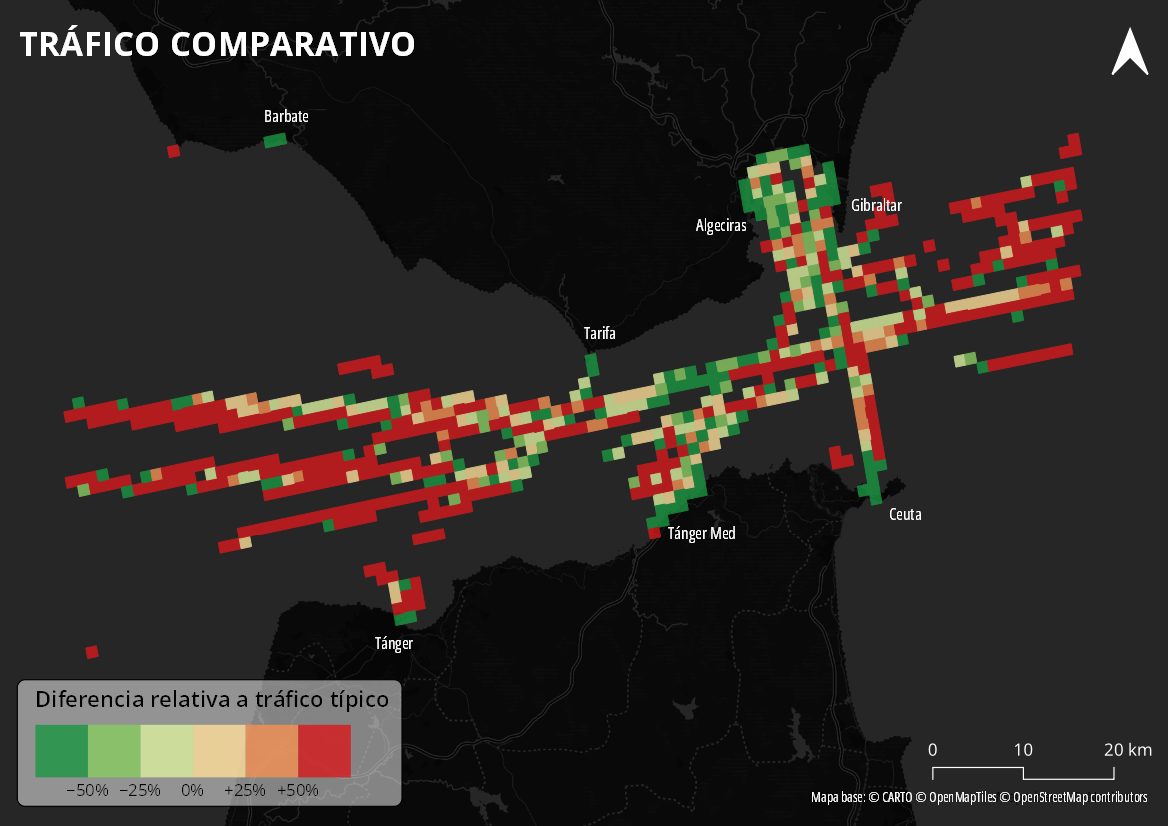
Comparative Traffic: "current" congestion levels are compared to a baseline.

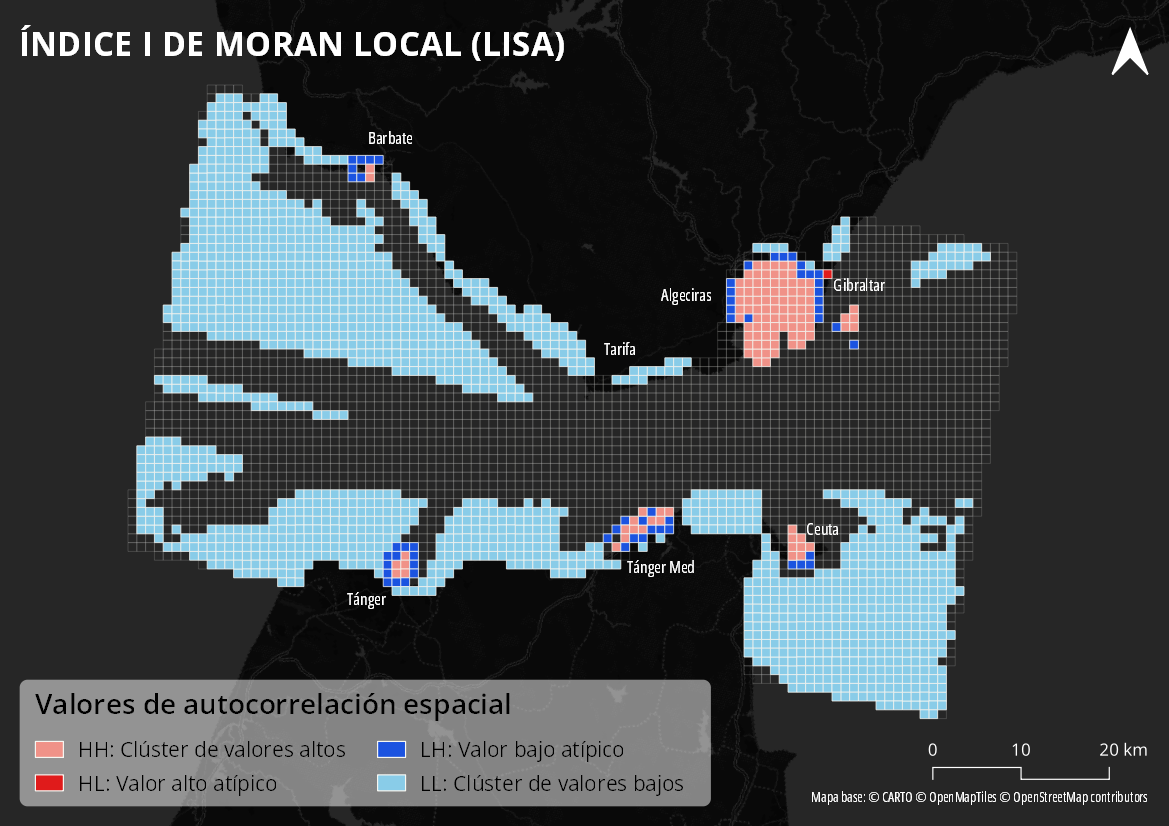
Spatial Autocorrelation (LISA): shows clusters and outliers of high (H) and low (L) levels of traffic density.

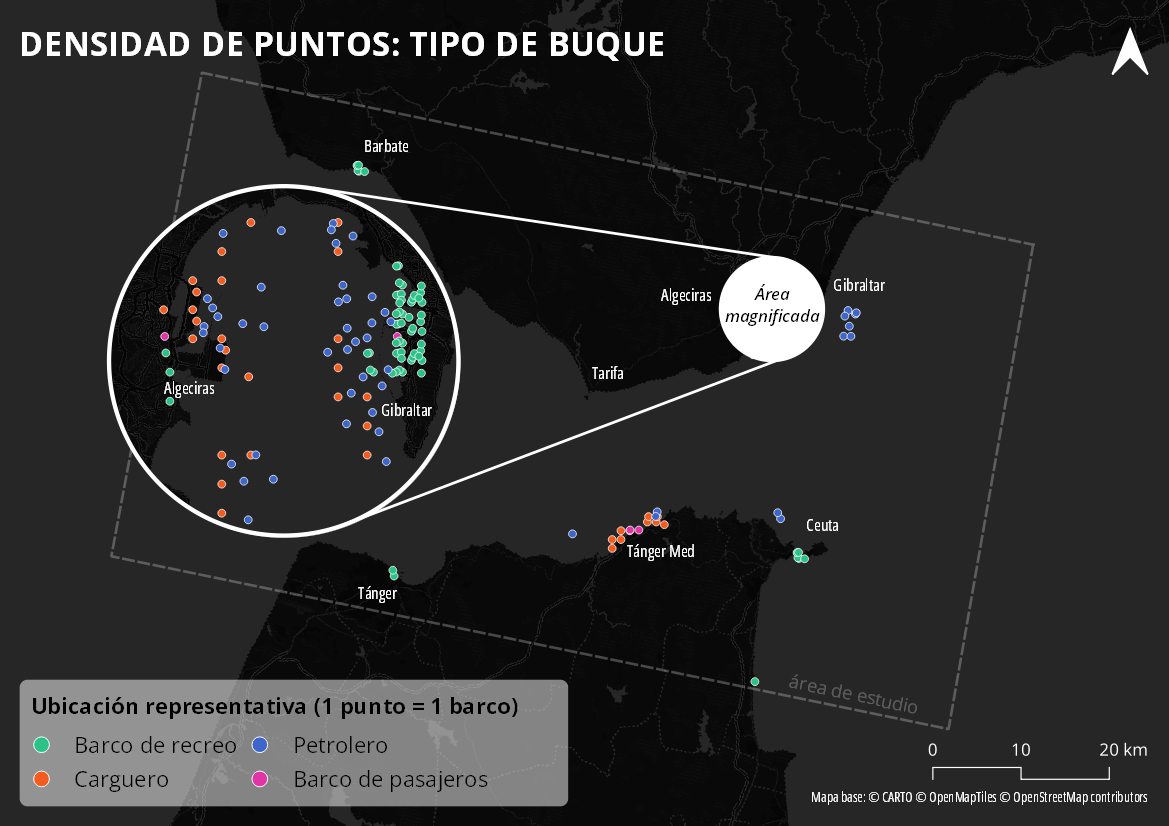
Vessel Class Dot Density: uses representative locations to portray a "snapshot" of the types of boats expected to be seen in the Strait on an average day.
Hour-by-hour animation of vessel density during study period. Darker shades represent more vessels per cell.